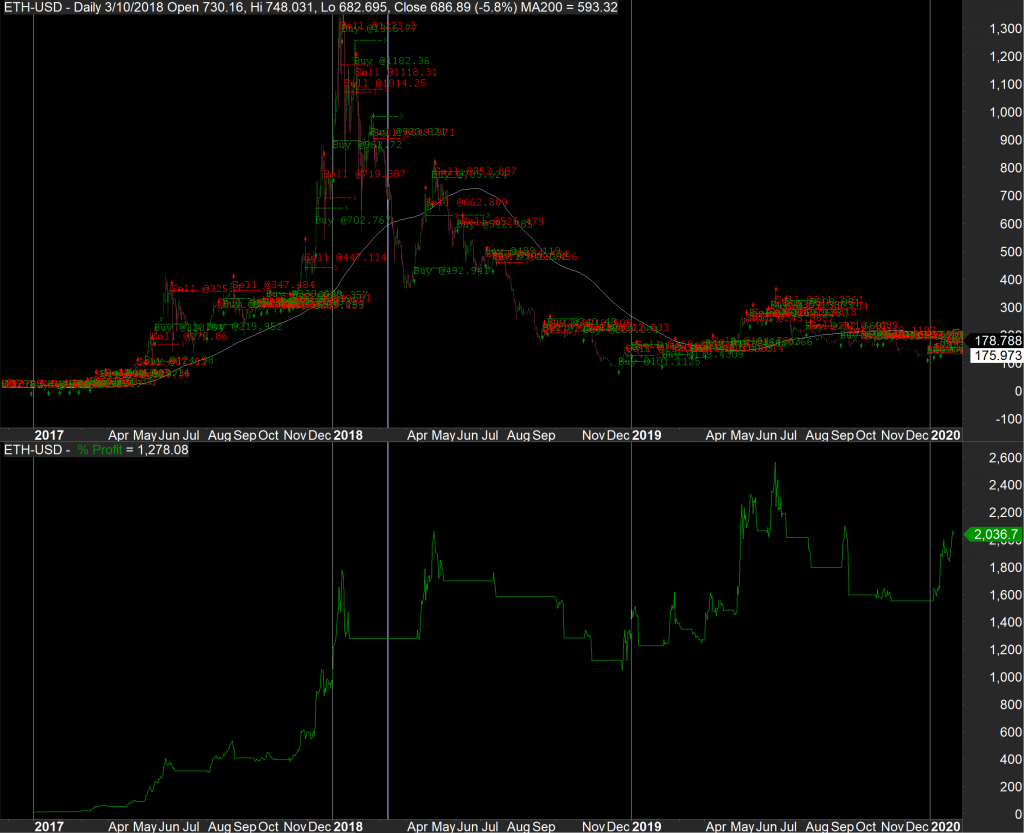
The Bull Bear Ethereum Investment Strategy
Backtest statistics vs Buy and Hold
January 2017 to February 2020
| All trades | Buy&Hold (ETH-USD) | |
| Initial capital | 10,000.00 | 10,000.00 |
| Ending capital | 2,036,699.7 | 218,108.7 |
| Net Profit | 2,026,699.77 | 208,108.78 |
| Net Profit % | 20,267.00% | 2,081.09% |
| Exposure % | 47.73% | 100.00% |
| Net Risk Adjusted Return % | 42458.79% | 2081.09% |
| Annual Return % | 461.20% | 171.85% |
| Risk Adjusted Return % | 966.20% | 171.85% |
| Max. trade drawdown | -504114.11 | -1600686.62 |
| Max. trade % drawdown | -28.15 | -93.96 |
| Max. system drawdown | -1014082.13 | -1600686.62 |
| Max. system % drawdown | -49.09% | -93.96% |
| Recovery Factor | 2.00 | 0.13 |
| CAR/MaxDD | 9.40 | 1.83 |
| RAR/MaxDD | 19.68 | 1.83 |
| Profit Factor | 2.55 | inf |
| Payoff Ratio | 2.09 | nan |
| Standard Error | 343892.27 | 294065.92 |
| Risk-Reward Ratio | 1.84 | -0.15 |
| Ulcer Performance Index | 17.61 | 2.53 |
| Sharpe Ratio of trades | 1.56 | inf |
| K-Ratio | 0.05 | -0.00 |
| Monthly and Year Returns | |||||||||||||
|---|---|---|---|---|---|---|---|---|---|---|---|---|---|
| Year | Jan | Feb | Mar | Apr | May | Jun | Jul | Aug | Sep | Oct | Nov | Dec | Yr% |
| 2017 | 27.7% | 50.0% | 214.9% | 31.7% | 184.7% | 38.0% | 0.0% | 67.6% | -24.1% | -0.3% | 43.9% | 69.2% | 9531.5% |
| 2018 | 32.7% | 0.0% | 0.0% | 32.3% | 0.3% | 0.0% | -6.8% | 0.0% | -0.0% | -19.0% | -12.8% | 14.3% | 32.6% |
| 2019 | -4.2% | 13.7% | -9.2% | 17.2% | 54.4% | -3.3% | -9.1% | -10.8% | -11.2% | -0.9% | -1.9% | 0.0% | 21.3% |
| 2020 | 31.4% | N/A | N/A | N/A | N/A | N/A | N/A | N/A | N/A | N/A | N/A | N/A | 31.4% |
| Avg | 21.9% | 21.3% | 68.6% | 27.1% | 79.8% | 11.6% | -5.3% | 18.9% | -11.8% | -6.7% | 9.7% | 27.9% |
For the BBE strategy details, information and historical performance please send us a request.