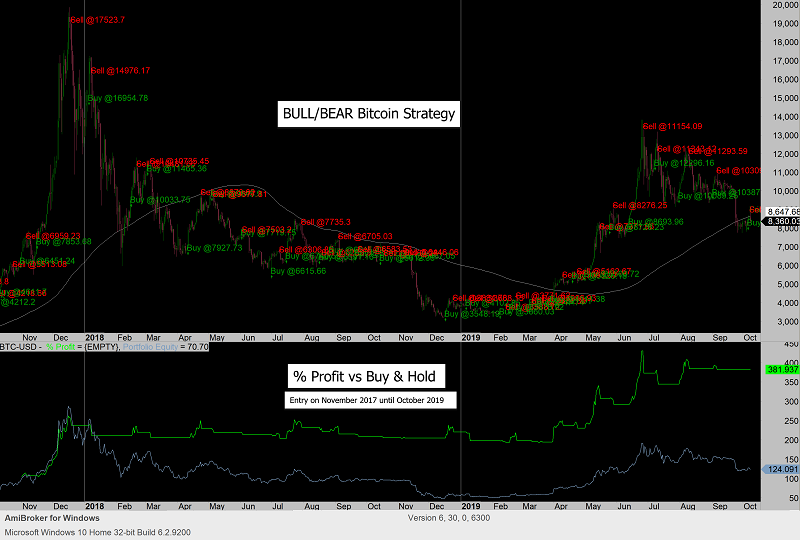
BBB Investment Strategy
Backtest statistics vs Buy and Hold
January 2012 to November 2019
| The BB Bitcoin Strategy | >Bitcoin Buy&Hold | |||
|---|---|---|---|---|
| Initial capital | 10,000.00 | 10,000.00 | ||
| Ending capital | 85,749,303.91 | 17,355,349.48 | ||
| Net Profit % | 857,393.04% | 173,453.49% | ||
| Exposure % | 36.02% | >100.00% | ||
| Net Risk Adjusted Return % | 2,380,565.11% | 173,453.49% | ||
| Annual Return % | 217.54% | 158.99% | ||
| Max. trade % drawdown | -28.26 | -90.99 | ||
| Max. system % drawdown | -36.68% | -90.99% | ||
| Recovery Factor | 4.20 | 0.56 | ||
| CAR/MaxDD | 5.93 | 1.75 | ||
| RAR/MaxDD | 16.47 | 1.75 | ||
| Profit Factor | 3.03 | inf | ||
| Payoff Ratio | 2.52 | nan | ||
| Risk-Reward Ratio | 0.62 | 0.49 | ||
| Ulcer Performance Index | 13.00 | 2.90 | ||
| Sharpe Ratio of trades | 1.66 | inf | ||
| K-Ratio | 0.03 | 0.02 | ||
| Monthly and Year Returns | |||||||||||||
|---|---|---|---|---|---|---|---|---|---|---|---|---|---|
| Year | Jan | Feb | Mar | Apr | May | Jun | Jul | Aug | Sep | Oct | Nov | Dec | Yr% |
| 2012 | 19.8% | -9.4% | -15.4% | -6.0% | 0.0% | 11.9% | 21.6% | 20.9% | 8.8% | 0.9% | 8.7% | 7.1% | 81.4% |
| 2013 | 49.1% | 62.7% | 164.2% | 41.3% | 4.4% | -5.6% | 4.8% | 21.8% | -11.5% | 37.7% | 429.5% | -16.2% | 6054.9% |
| 2014 | 2.3% | -3.2% | 7.3% | -7.6% | 33.4% | 0.4% | -2.9% | 0.0% | 0.0% | 1.7% | 7.7% | 0.0% | 39.8% |
| 2015 | -4.7% | -0.2% | 12.8% | -5.6% | -5.2% | 7.6% | 9.8% | 0.0% | -3.5% | 30.7% | 27.1% | 16.6% | 111.6% |
| 2016 | -2.6% | 7.5% | -4.1% | 4.1% | 18.2% | 23.8% | -5.1% | 0.0% | 1.1% | 8.9% | -3.5% | 24.3% | 91.7% |
| 2017 | 2.0% | 16.5% | 3.6% | 26.6% | 29.4% | 6.5% | -9.7% | 35.5% | 0.8% | 16.4% | 41.2% | 72.4% | 649.8% |
| 2018 | -13.1% | -1.9% | -5.9% | 12.0% | -3.2% | -2.8% | 10.6% | -0.4% | -5.8% | -1.8% | -1.2% | 7.6% | -8.6% |
| 2019 | -9.7% | 2.1% | 0.0% | 18.5% | 27.4% | 27.9% | -7.4% | 12.4% | -0.1% | -3.5% | -0.5% | N/A | 77.7% |
| Avg | 5.4% | 9.3% | 20.3% | 10.4% | 13.0% | 8.7% | 2.7% | 11.3% | -1.3% | 11.4% | 63.6% | 16.0% |
For the B/B/B strategy details, information and historical performance please send us a request.